Performance Monitoring with Flutter
Performance monitoring is key to maintaining high-quality Flutter apps. Discover tools and techniques to track app performance, identify bottlenecks, and optimize your Flutter applications for better speed, responsiveness, and user experience.
by Lin Yan Khong,
Importance of application performance
In today’s technology driven world, people are always looking for swift progress, leading to a broad usage of mobile applications which helps to simplify their everyday tasks.
App performance now takes a very important role for an application, users are not just looking for a clean and functional UI, they are also looking for applications that perform well. An application with bad performance may lead to low user engagement as it might affect users in utilising extra time than without it.
What to monitor for performance?
1. CPU Utilisation Monitoring
High CPU utilisation shows the device is under a heavy load, which might cause the system to freeze or stop responding that leads to an unscheduled restart if it is overloaded for a long period.
2. Server Access Logs Monitoring
Server access logs contain valuable information of all activity called between the server and application over a defined period of time. This information can be used to diagnose and fix issues with the system as well as to identify potential threats.
3. Error Rate Monitoring
Error rating is always taken as critical consideration which includes application crash and networking error. It stands in an important place as this will ensure the quality of the application to always meet or exceed customer expectations.
4. App Dependencies Monitoring
Dependencies of an application will affect the number of users to use the application as it leads to hardware, software and system components. Outdated dependencies might not be supported in later systems, lowering down the number of users reached to your application.
5. Speed Monitoring
In today’s fast-paced world, people seek for applications that satisfy their needs of time saving, a smooth and efficient application will provide them better user experience.
Flutter Performance Monitoring Tools
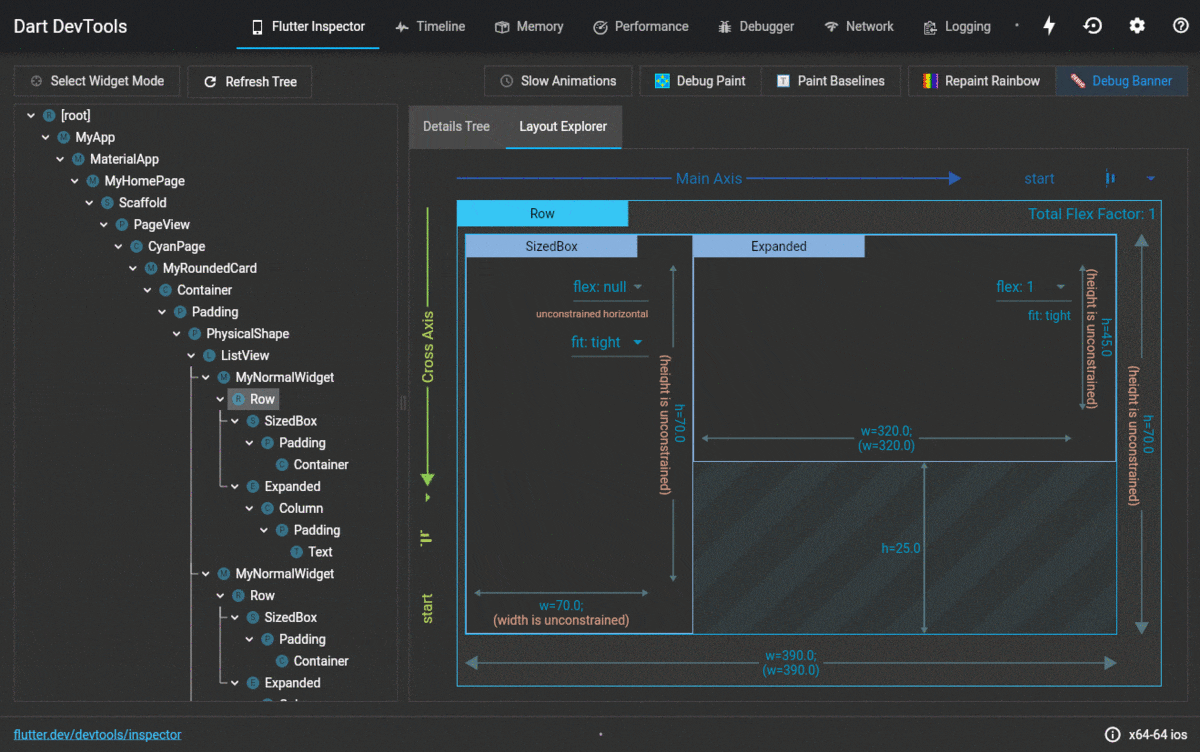
Flutter DevTools (In house tool)
A suite of debugging and profiling tools for Flutter that can be used in conjunction with existing IDE or command-line development workflow. It offers some of the features below for better monitoring:
- Inspecting UI layout and state
- Diagnose UI jank performance issues
- CPU profiling
- Network profiling
- Source-level debugging
- Debug memory issues
- View general logs and diagnostics information
- Code and app size analysis
This tool will not need any extra code inserting as it is wrapped by Flutter itself, therefore there aren't any extra dependencies for this tool to be used.
However, this tool can only be used for local debug or profile mode running of applications, it does not support other user application analytics.

Firebase Performance Monitoring (Third-party tool)
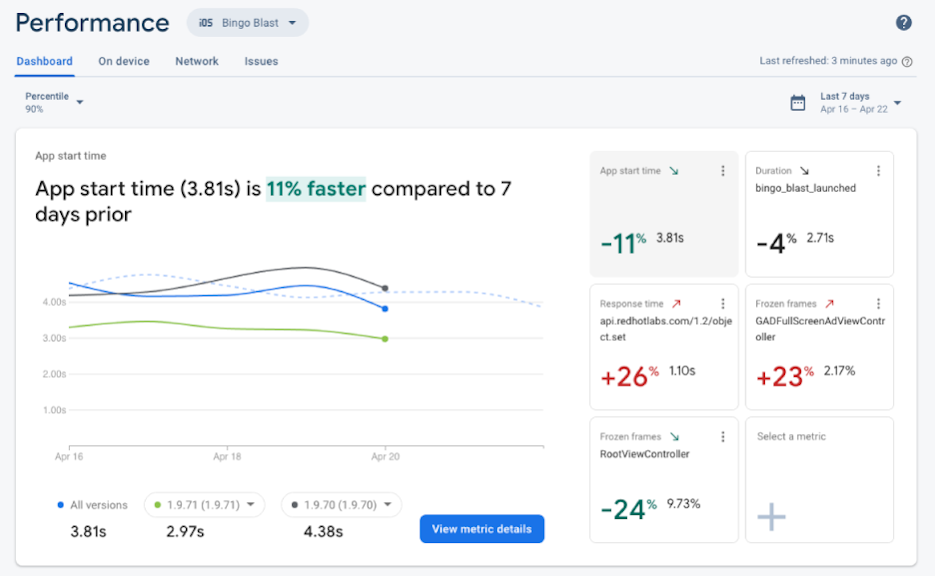
Performance data for every user worldwide will be captured for analysis and review in the Firebase Performance Monitoring console. It helps to understand real time performance of your application of where it could be improved. The key features are found as below:
- Automatic measures app startup time, HTTP network requests and rendering data by screens.
- Gain insight on app performance improvement.
- Customize monitoring for application
- Identify significant changes in app performance.
Since this is a third-party tool, there will be an existing SDK to be implemented in the application. However the integration of Firebase Performance Monitoring SDK is easy, just by importing the firebase_performance package and it can start to collect data related to app’s lifecycle and data for http/s network requests.
Below image retrieved from Firebase Blog written by Nitin Kaushik

Sentry.io
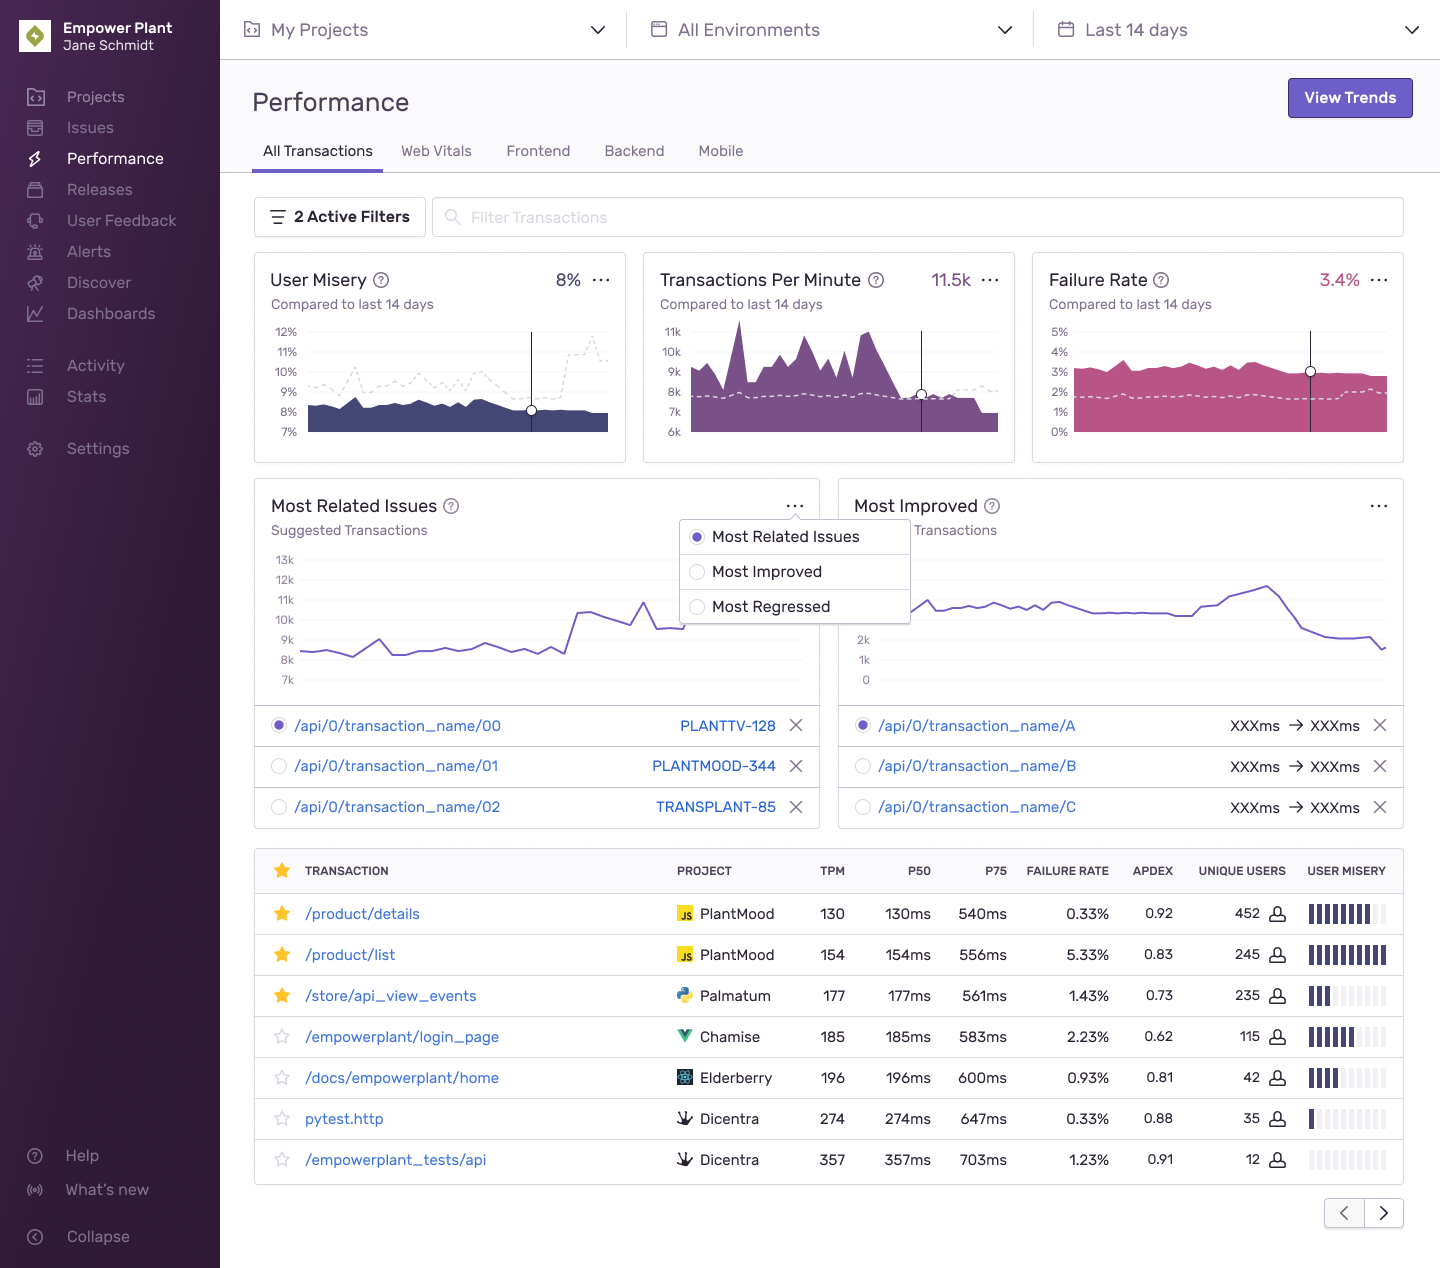
A developer-first error tracking and performance monitoring platform which helps developers to see what is the main issue, leading to quicker solutions and learning continuously about the application. The monitorable data for this tool are as below:
- Automatic detection of Application Not Responding (ANR) on Android and App Hangs on iOS.
- Release Health
- Tracing of app start time, time to initial display/ full display, slow or frozen frames, user interactions and many more.
- User Feedback collection on unexpected event occurrence.
- Profiling data collected from code function level.
- Source context that shows snippets of code around location of stack frame
- Crash reports with actionable, breadcrumbs, screenshots, stack traces and suspect commits.
By signing up to this tool’s account, the SDK can be integrated with sentry_flutter package for Flutter projects. Some integrations with the SDK will be needed such as wrapping the app runner with Sentry’s initialise method which is important for this tool to start monitoring the app performance.
Below image retrieved from Medium by Aditya Putra Pratama

Best Practices
Guidelines and principles are set as the best practices to follow where it can improve the quality, efficiency and security of the application. If the practices are followed well, one can avoid common pitfalls and provide an application that is more reliable, maintainable and user-friendly.
1. Control build() cost
Flutter’s widget-based architecture encourages UI flexibility but this architecture could lead to excessive widget rebuilds if overly large single widgets with a large `build()` function is used. In order to control the cost, the below practices are recommended:
- Use `const` constructors for immutable widgets to reduce rebuilds.
- Create reusable pieces of UIs with Stateless Widget rather than a function.
- Localise the `setState()` call to part of subtree where the UI actually needs to be updated.
2. Understanding the concept of constraints
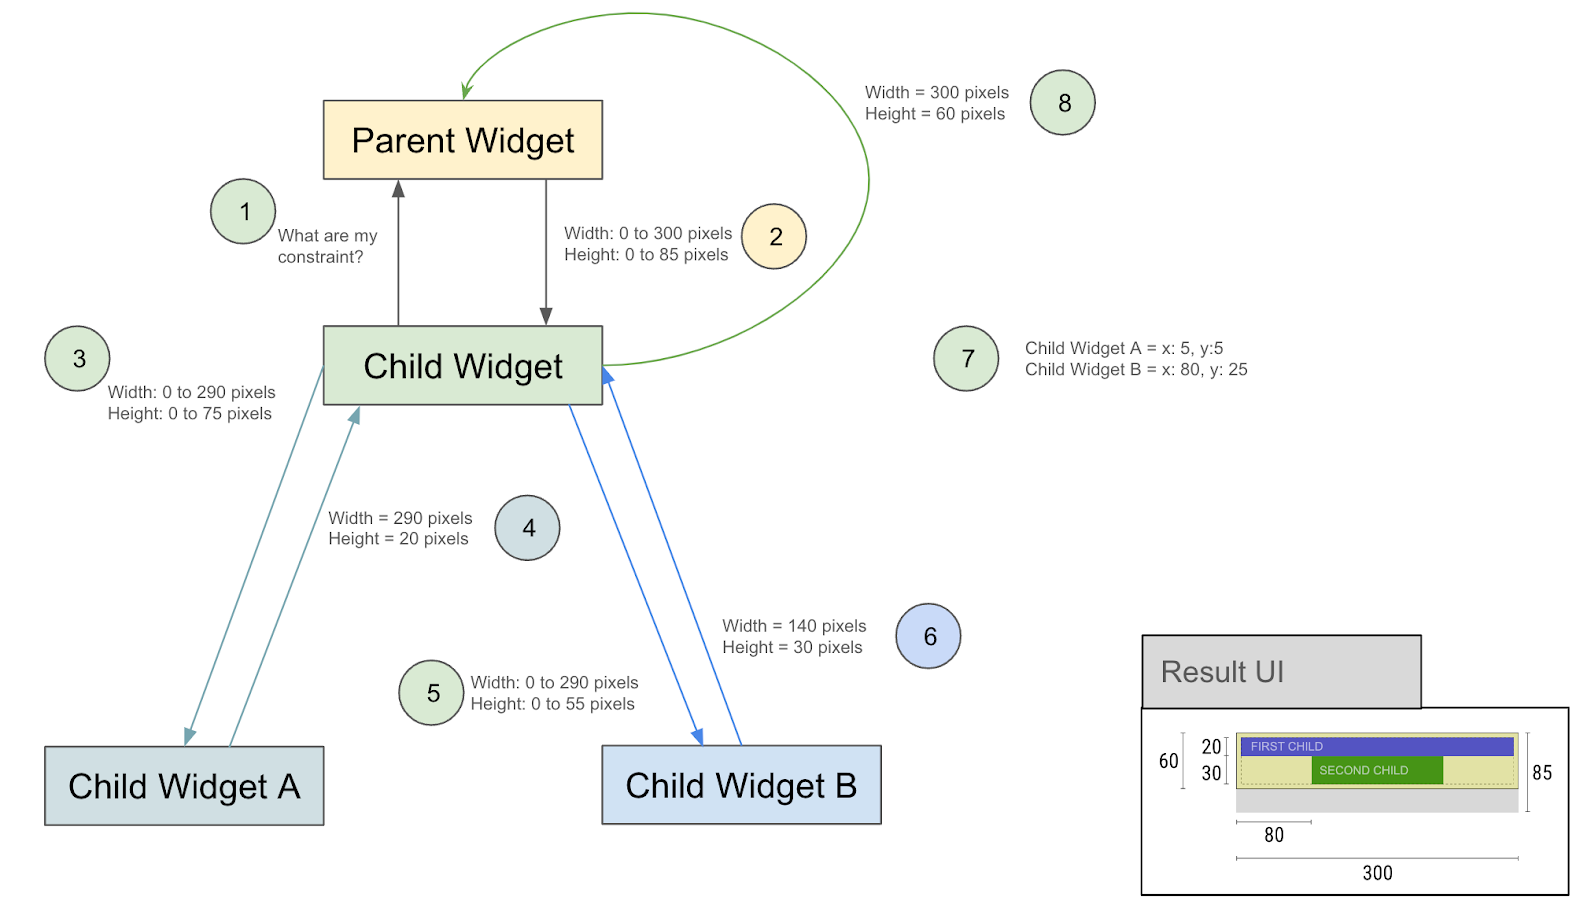
The Flutter’s basic layout rule: Constraints go down. Sizes go up. Parent sets position.
The explanation of the rule is as below, where parents provide constraints and children provide to parent the size, then parent will set their positions.

A child widget can’t know or decide its own position, it can only decide its own size within the provided constraints by its parent.
In normal cases, this communication will go through once but a second pass (Intrinsic pass) might be needed under conditions where there's a need of all widget sizes to match the largest or smallest cell. In order to avoid intrinsic passes, one could set the cells to fixed size or choose a particular cell to be the anchor cell.
3. Use streams wisely
Streams are pretty powerful, but overuse of it could lead to memory and CPU usage outage or even worse, if one forgot to close the stream, it could cause memory leakage.
A similar replacement for streams are ChangeNotifier which provides reactive UI and Bloc library that offers a simple interface for building reactive UI.
4. Minimise use of opacity and clipping
Opacity and clipping are expensive operations as they are a stack of UI that takes up the GPU rendering. Instead of using an opacity widget, it is usually faster to just draw with semi-transparent colour or one could use FadeInImage which applies slow opacity using GPU’s fragment shader.
Clipping operation is also costly, however it has been disabled by default and it doesn’t call the `saveLayer()` unless specified.
Widget _doBuildRectangle() {
 return Center(
     child: Container(
   decoration: const BoxDecoration(borderRadius: BorderRadius.all(Radius.circular(20)), color: Colors.red),
   height: 100,
   width: 200,
 ));
}

Widget _doNotBuildRectangle() {
 return Center(
     child: ClipRRect(
         borderRadius: const BorderRadius.all(Radius.circular(20)),
         child: Container(
           color: Colors.red,
           width: 200,
           height: 100,
         )));
}
Conclusion
Flutter Performance Monitoring is crucial to serve happy users. With the help of monitoring tools and best practices followed, one can assure that the application could run smoothly and there will be minimum to nil redundant or background jobs throughout the growth of application. Always keep in mind that optimisation for an application shall be taken regularly while new features or updates are done to the application to maintain application smoothness.

